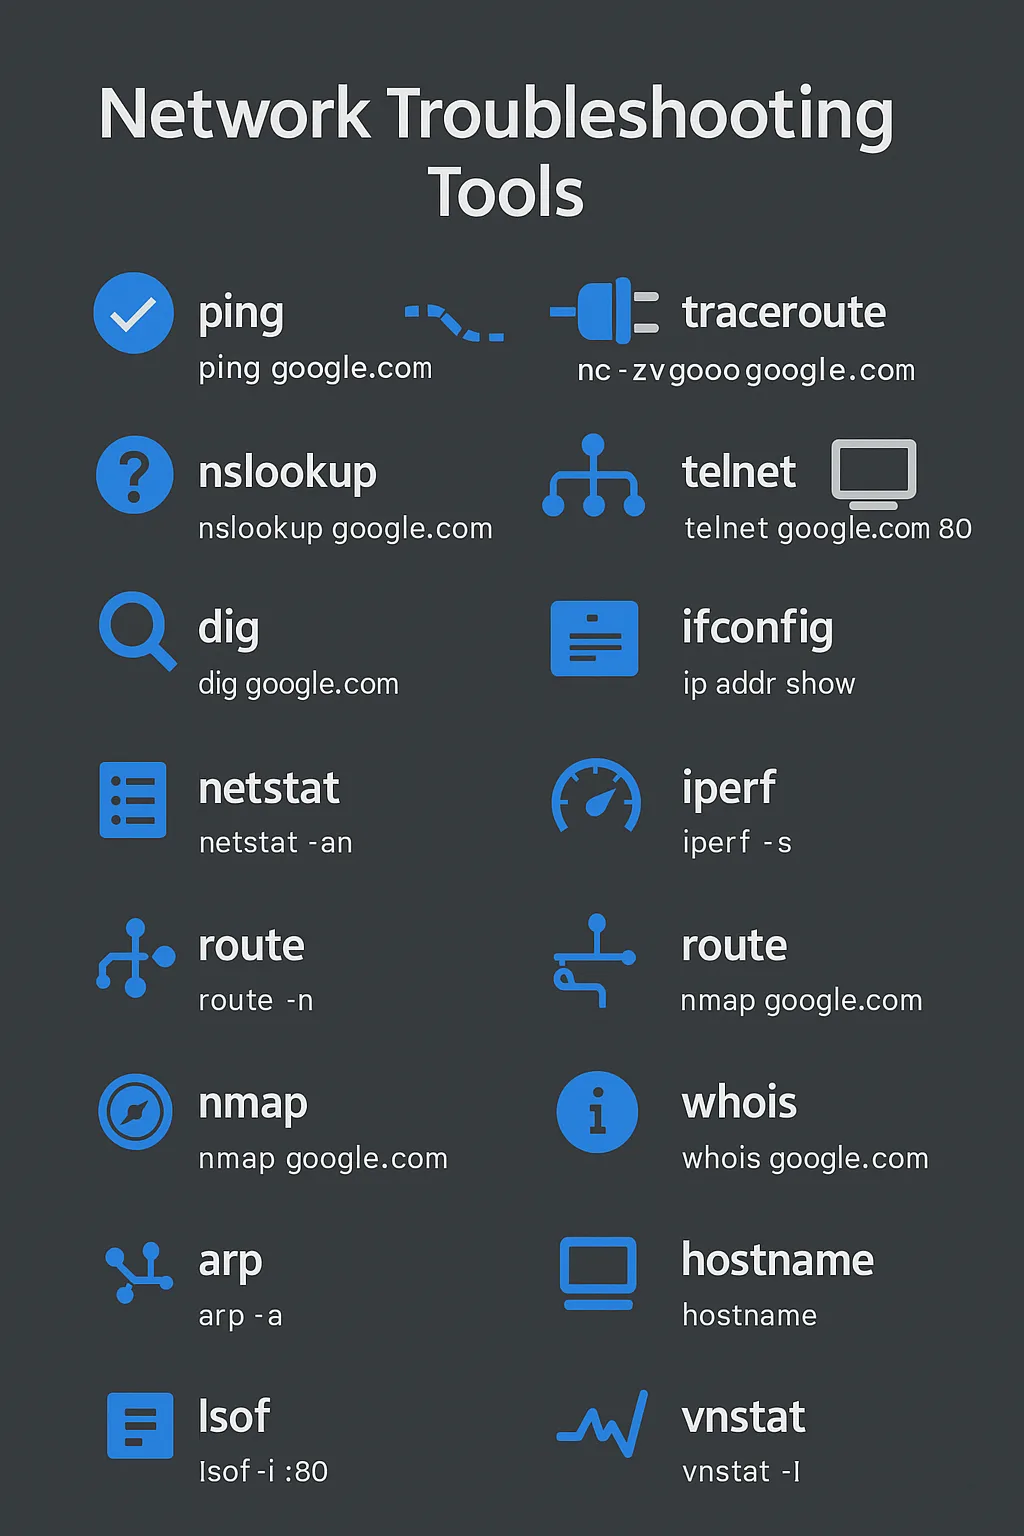
Everyday Network Troubleshooting: Tools You Should Know (and Actually Use)
Whether you’re debugging why a pod can’t reach an endpoint or trying to figure out why your app’s requests are timing out, networking tools are your first line of defense.
Here’s a curated, opinionated, and battle-tested list of tools I use (almost) daily. Each one comes with practical examples.
Connectivity & Reachability
ping
Checks if a host is alive using ICMP echo requests.
ping google.com
ping -c 4 192.168.1.1 # -c 4 is to send 4 packetsTip: If ping doesn’t work, the host could be up but blocking ICMP. Check firewall rules.
traceroute
Visualise the path packets take to a remote host. Great for pinpointing bottlenecks.
traceroute google.com
traceroute -I 192.168.1.1 # -I is to use ICMP echo requests
Use case: “Why is latency high between service A and B?” → traceroute.
nslookup
Simple tool for querying DNS. Quick and dirty.
nslookup google.com
nslookup 8.8.8.8
dig
More verbose and powerful DNS query tool than nslookup.
dig google.com
dig google.com ANY # ANY is to get all records
dig google.com A +short # A is to get A records
dig google.com AAAA +short # AAAA is to get AAAA recordsBonus: Use +trace to debug DNS resolution path:
dig +trace google.com
dig +trace google.com +short # +short is to get the IP address
Port Scanning & TCP Checks
netcat (nc)
The Swiss Army Knife of TCP/UDP.
nc -zv google.com 80
nc -l 1234  # Listen on port 1234
nc -zv 192.168.1.1 1-65535 # -z is to scan all portsTip: nc can be used to spin up fake HTTP servers or test port exposure in firewalled networks.
telnet
Old school, but works.
telnet google.com 80Can be used to debug HTTP, SMTP, Redis manually.
Interface & Routing Info
ip (modern)
ip addr show
ip route show
ip link set eth0 up
ifconfig (legacy but familiar)
ifconfig
ifconfig eth0 up
route (macOS)
route -n
route add default gw 192.168.1.1
Monitoring Traffic & Usage
netstat
netstat -an
netstat -r
ss (modern netstat replacement)
ss -tuln
ss -s
tcpdump
Capture packets like a boss.
tcpdump -i eth0
tcpdump -i eth0 -w capture.pcapTip: Combine with wireshark to visualize packets.
tshark
CLI version of Wireshark.
tshark -i eth0
tshark -r capture.pcap
vnstat
Track bandwidth usage.
vnstat -l
vnstat -d
nload / nethogs
Real-time network I/O monitor per interface or per process.
nload
nethogs
Wireless Tools
iw
iwlist
iwconfig
These are useful on laptops, Raspberry Pi setups, or Linux wireless APs.
Security, Scanning & Recon
nmap
Port scanner and network mapper.
nmap google.com
nmap -sP 192.168.1.0/24
Pro tip: Use with -A for OS detection, versioning, script scanning.
whois
Lookup domain ownership.
whois google.comlsof
See what ports your system is listening on.
lsof -i :80
lsof -i tcp
arp / arping
arp -a
arp -d 192.168.1.1
arping 192.168.1.1Use for static IP-to-MAC mapping debugging or LAN sniffing.
Bandwidth Testing
iperf
Client-server bandwidth tester.
iperf -s          # Start server
iperf -c <ip>     # Run client against server
Works great for diagnosing slow internal links or tunnels.
mtr
Combines ping + traceroute with live stats.
mtr google.com
mtr google.com
mtr -r google.com
Instant visibility into jitter, loss, and latency by hop.
Bonus Mentions
conntrack – Show conntrack entries
ssdp – Debug multicast/UPnP
ncdu – Disk usage but worth knowing if you're debugging slow apps
hostname – Quick check or change the hostname
My Top 5 Daily Use Tools
| Purpose | Tool |
|---|---|
| Ping test | ping |
| DNS Resolution | dig |
| Port connectivity | nc / telnet |
| Interface info | ip addr |
| Live traffic debug | tcpdump |
Final Thoughts
These tools are deceptively simple—but when chained together, they help you uncover:
- Firewall misconfigurations
- DNS issues
- Interface problems
- Packet loss/jitter
- Port blocks or misroutes
- Host reachability vs app-level downtime
Bookmark this. Refer to it next time you’re troubleshooting networking issues.