I’ve spent the last decade watching teams build observability backwards.
They ship a service. It breaks at 2am. Someone spends three hours grepping CloudWatch logs in one tab, checking Kubernetes pod logs in another, and praying the timestamps line up. Then they bolt on monitoring as a “fast follow” that never actually follows.
OpenTelemetry fixes this. Not in a theoretical, conference-talk kind of way. In a “your on-call engineer stops dreading pages” kind of way.
I built an observability lab that instruments services across Kubernetes, AWS Lambda, ECS Fargate, and EC2 - all running locally with Kind and LocalStack. This post is what I learned, what I think about OTel, and why I believe it’s the most important shift in observability since Prometheus.

The Real Problem Nobody Talks About
Most production environments are a mess of compute types. You’ve got containers on Kubernetes, Lambda functions for event-driven work, ECS tasks for batch processing, maybe some EC2 instances running things nobody wants to touch. Each one has its own logging format, its own metrics system, and its own way of not doing tracing.
Here’s what that actually looks like:
- CloudWatch for Lambda and ECS, but with different log formats
- Prometheus for Kubernetes, but no trace correlation
- X-Ray sometimes, but only if someone bothered to instrument it
- Datadog or New Relic agents on EC2, but they don’t talk to the Kubernetes stack
- Three dashboards open, none of them telling the full story
I’ve lived this. Multiple times. At different companies. It’s not a tooling problem - it’s a fragmentation problem. And you can’t solve fragmentation by adding more tools.
Why OpenTelemetry Actually Matters
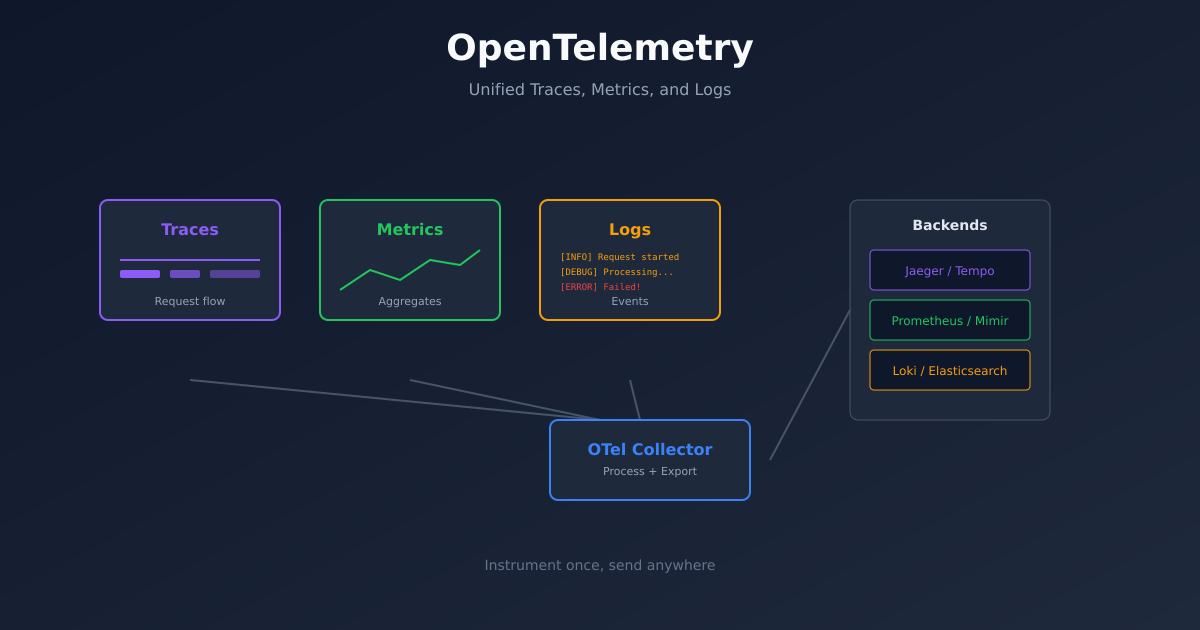
OTel isn’t just another monitoring library. It’s a standardisation layer. That distinction matters more than people realise.
One SDK, Every Compute Type
The Python app running on ECS Fargate uses the same opentelemetry-sdk as the Lambda function. The Go service on EC2 uses the same otel package as the one in Kubernetes. You learn the instrumentation API once and it works everywhere.
In the lab, I instrumented five services across four compute types. The instrumentation patterns were nearly identical regardless of where the code runs. That’s not a small thing. That’s the difference between “observability is easy” and “observability is another project.”
Vendor Neutrality (For Real This Time)
I’ve watched teams spend quarters migrating from one observability vendor to another. Datadog to Grafana Cloud. New Relic to Honeycomb. Each time, it means touching every service, changing imports, updating configurations, and hoping nothing breaks.
With OTel, your instrumentation is decoupled from your backend. The Collector sits in the middle. Today it exports to Jaeger and Prometheus. Tomorrow you can swap in Grafana Tempo or Honeycomb without touching a single line of application code. The collector config changes; the app doesn’t.
This isn’t theoretical. I’ve done it. Changing backends is a YAML edit, not a quarter-long migration project.
Context Propagation Across Everything
Here’s where it gets genuinely powerful. A trace that starts in a Lambda function, hits an ECS task, and finishes in a Kubernetes pod - OTel’s context propagation (W3C TraceContext) carries the trace ID across all of them. One distributed trace spanning three different compute platforms.
Try doing that with CloudWatch alone. I’ll wait.
The Architecture That Works
After a lot of iteration, I landed on a two-tier collector architecture that I think is the right pattern for most teams:
Apps on K8s  ──→  DaemonSet Collector (per-node)  ──→  Gateway Collector  ──→  Backends
Lambda       ──→                                       ↑
ECS          ──→  Sidecar Collector                ────┘
EC2          ──→  Direct OTLP                      ────┘
DaemonSet Collectors run on each Kubernetes node. They receive telemetry from local pods via hostPort on 4317. This keeps network hops minimal and gives you per-node processing if you need it.
Gateway Collector is the central aggregation point. It receives from the DaemonSet collectors plus external sources (Lambda, ECS, EC2) and fans out to your backends - Jaeger for traces, Prometheus for metrics.
Why two tiers? Because you want to batch and process locally before sending to the gateway. It reduces network traffic, gives you a place to add sampling, and means your external sources (Lambda, ECS) have a single stable endpoint to target.
The Collector Config
The config is deceptively simple:
receivers:
  otlp:
    protocols:
      grpc:
        endpoint: 0.0.0.0:4317

processors:
  batch:
    timeout: 10s
    send_batch_size: 1024
  resource:
    attributes:
      - key: k8s.cluster.name
        value: otel-demo
        action: insert

exporters:
  otlp/jaeger:
    endpoint: jaeger:4317
    tls:
      insecure: true
  prometheus:
    endpoint: "0.0.0.0:8889"
    resource_to_telemetry_conversion:
      enabled: true

service:
  pipelines:
    traces:
      receivers: [otlp]
      processors: [resource, batch]
      exporters: [otlp/jaeger]
    metrics:
      receivers: [otlp]
      processors: [resource, batch]
      exporters: [prometheus]
Receivers, processors, exporters, pipelines. That’s the mental model. Everything else is configuration details.
Instrumenting Go and Python - What It Actually Looks Like
Go
The Go instrumentation is clean. You initialise the SDK once, get a tracer and meter, and use them throughout your app:
tracer := otel.Tracer("demo-go-app")
meter := otel.Meter("demo-go-app")

// Wrap your HTTP server
handler := otelhttp.NewHandler(mux, "go-demo-server")

// Create manual spans for business logic
func (o *OrderService) ProcessOrder(ctx context.Context, orderID string) error {
    _, span := o.tracer.Start(ctx, "order_service.process_order")
    defer span.End()

    span.SetAttributes(
        attribute.String("order.id", orderID),
    )

    // Your business logic here
    o.simulatePaymentProcessing(ctx, order)
    o.simulateInventoryCheck(ctx, order)

    return nil
}
The otelhttp middleware handles HTTP spans automatically. For business logic - order processing, payment simulation, inventory checks - you create manual spans. Each span becomes a node in the trace waterfall.
What I like about the Go SDK: it’s explicit. You pass context everywhere (which you should be doing anyway), and the span hierarchy falls out naturally.
Python
Python’s auto-instrumentation is where OTel really shines for getting started fast:
from opentelemetry.instrumentation.flask import FlaskInstrumentor
from opentelemetry.instrumentation.requests import RequestsInstrumentor

FlaskInstrumentor().instrument()
RequestsInstrumentor().instrument()
Two lines and every Flask endpoint and outbound HTTP call is traced. Then you add manual spans for business logic:
with tracer.start_as_current_span("complex_processing") as span:
    with tracer.start_as_current_span("validation") as validation_span:
        validation_span.set_attribute("validation.rules_checked", 5)
        # validate...

    with tracer.start_as_current_span("external_api_call") as api_span:
        api_span.set_attribute("api.service", "enrichment-service")
        # call external service...
The context manager pattern makes it almost impossible to forget to close a span. The nesting creates parent-child relationships automatically.
The Lambda Problem (And How OTel Solves It)
Lambda is where observability traditionally falls apart. Short-lived functions, cold starts, CloudWatch being the only native option. X-Ray exists but requires its own SDK and doesn’t talk to your Kubernetes tracing.
With OTel, the Lambda function initialises the SDK on cold start and exports traces via OTLP to the same collector gateway your Kubernetes services use. Same trace format, same backend, same Jaeger UI. A trace that starts with an API Gateway request, triggers a Lambda, and calls an ECS task shows up as one unified trace.
Cold start vs warm invocation? Track it as a span attribute. Now you can actually measure cold start impact across your Lambda fleet instead of guessing.
Opinions - The Stuff Nobody Puts in Documentation
Start With Traces, Not Metrics
Every OTel tutorial starts with “three pillars of observability: traces, metrics, and logs.” That’s technically correct but practically useless for prioritisation.
Start with traces. They give you the most bang for your instrumentation effort. A single distributed trace tells you more about a request failure than a hundred metric dashboards. Once you have traces, you can derive metrics from them (RED metrics from span data). Logs come last - and honestly, structured log attributes attached to spans are more useful than standalone log lines.
Auto-Instrumentation Is Table Stakes, Not The Goal
Auto-instrumentation gets you HTTP spans and database calls for free. That’s great for getting started. But the real value comes from manual spans on your business logic.
Nobody cares that an HTTP POST took 450ms. They care that payment processing took 200ms, inventory check took 150ms, and the remaining 100ms was validation. That level of detail requires manual instrumentation. Don’t skip it.
The Collector Is Your Best Friend
Run the collector. Always. Don’t export directly from your application to your backend.
The collector gives you:
- Batching (reduces network overhead)
- Retry logic (your app doesn’t block on export failures)
- Sampling (tail sampling at the collector level is powerful)
- Backend routing (send traces to Jaeger and metrics to Prometheus from one pipeline)
- A buffer between your apps and your backends (backend down? Collector queues)
Exporting directly from the app to the backend is fine for a tutorial. In production, it’s a reliability risk.
Resource Attributes Are Underrated
Every span and metric should carry resource attributes: service.name, deployment.environment, k8s.namespace.name, cloud.platform. These are what make your data filterable and actionable.
When something breaks at 3am, you want to filter traces by environment, service, and namespace without writing complex queries. Resource attributes make that possible. Invest the five minutes to set them up properly during initialisation.
Semantic Conventions Matter
OTel has semantic conventions for common attributes. Use them. http.method, db.system, db.operation - these aren’t suggestions. They’re what makes your telemetry interoperable across services written by different teams in different languages.
When your Go service records db.system: postgresql and your Python service records database_type: postgres, you’ve lost the ability to query across services. Semantic conventions prevent this.
What Actually Changes When You Adopt OTel
I’ll be direct about the measurable improvements I’ve seen:
MTTR drops dramatically. Before OTel, debugging a cross-service issue meant bouncing between tools and logs for 45-90 minutes. With distributed tracing, you get an alert with a trace ID, open it in Jaeger, see the failing span, read the error. Five to fifteen minutes. That’s not a marginal improvement - it’s a step change.
On-call gets less painful. “Something’s broken, start digging” becomes “Span X in service Y failed with error Z, here’s the trace.” Engineers stop dreading pages because they have context to act immediately.
New services come pre-instrumented. When OTel is in your service template, instrumentation is part of the first PR, not a “we’ll add monitoring later” ticket that sits in the backlog for six months.
Vendor migrations become boring. And boring is exactly what you want for infrastructure changes.
Try It Yourself
The full lab is at github.com/moabukar/otel-demo. One make setup command gives you:
- A Kind cluster with Go and Python services, fully instrumented
- OTel Collector in DaemonSet + Gateway topology
- Jaeger for traces, Prometheus for metrics, Grafana for dashboards
- LocalStack simulating Lambda, ECS, and EC2 workloads
- All sending telemetry to the same pipeline
Run make traffic to generate requests and open Jaeger at localhost:16686. Click through a few traces. See how spans nest, how context propagates across services, how errors are highlighted.
That ten minutes will teach you more about OpenTelemetry than any conference talk.
Final Thought
Observability isn’t about having the most dashboards or the fanciest tooling. It’s about answering “what’s broken and why” as fast as possible.
OpenTelemetry doesn’t give you observability. It gives you the foundation to build observability that actually works - across languages, across compute types, across vendors. It’s the unsexy standardisation layer that makes everything else possible.
And in my experience, the unsexy infrastructure decisions are the ones that compound the most over time.
If you’re still running three different monitoring stacks for three different compute types, you’re paying triple - in money, in cognitive overhead, and in MTTR. OpenTelemetry is the way out.
The code is open source. Go break it.