DORA metrics have become the standard for measuring DevOps performance. Every platform engineering talk mentions them. Every engineering leader wants them.
But most implementations fail. Teams collect the numbers without understanding what they mean. Dashboards get built but never improve anything. Metrics become targets that get gamed.
This guide covers how to implement DORA metrics in a way that actually drives improvement.
The Four Metrics
DORA research identified four key metrics that predict software delivery performance:
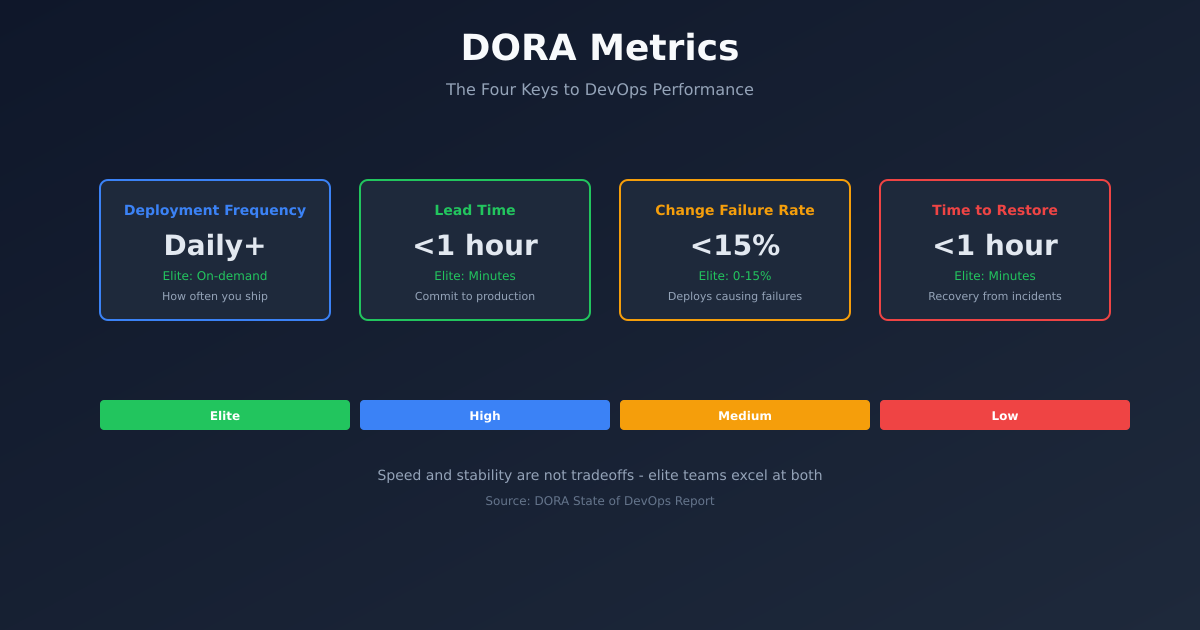
Deployment Frequency - How often you deploy to production. Elite performers deploy on-demand, multiple times per day.
Lead Time for Changes - Time from code commit to code running in production. Elite performers do this in less than an hour.
Change Failure Rate - Percentage of deployments that cause failures requiring remediation. Elite performers stay under 15%.
Time to Restore Service - How long it takes to recover from failures. Elite performers restore in under an hour.
These metrics are correlated. Teams that deploy frequently also have lower failure rates. Fast lead times correlate with faster recovery. This isn’t coincidence - the same practices that enable speed also enable quality.
Why These Metrics Matter
Traditional metrics measure activity: lines of code, story points, velocity. These metrics are easy to game and don’t correlate with business outcomes.
DORA metrics measure capability: can you deliver changes safely and quickly? This directly connects to business value.
A team that deploys daily with low failure rates can:
- Respond to customer feedback quickly
- Fix bugs before they compound
- Ship features while they’re still relevant
- Recover from incidents without panic
A team that deploys monthly with high failure rates cannot do these things, no matter how many story points they complete.
Measuring Deployment Frequency
Deployment frequency sounds simple but has nuance.
What counts as a deployment? I define it as any change that reaches production, including:
- Feature releases
- Bug fixes
- Configuration changes
- Infrastructure updates
Where to measure? Pull from your deployment tool. If you’re using ArgoCD, query ArgoCD. If you’re using GitHub Actions, query GitHub. Don’t make humans log deployments manually.
A simple query for GitHub Actions:
gh api repos/org/repo/actions/runs \
  --jq '[.workflow_runs[] | select(.conclusion == "success" and .name == "Deploy")] | length'
For ArgoCD:
argocd app history my-app --output json | jq 'length'Aggregation. Calculate daily, weekly, and monthly frequencies. The trend matters more than any single number.
Per team vs system-wide. Track both. Some teams might deploy frequently while others are blocked. You need visibility into both.
Measuring Lead Time
Lead time is the most technically challenging metric to collect.
Definition. Time from first commit in a change to that change running in production.
The tricky part. A deployment might include multiple commits, PRs, and merges. You need to trace back to the first commit.
If you’re using conventional commits or PR-based workflows, you can trace from deployment to PR to commits.
For GitHub-based workflows:
def calculate_lead_time(deployment_sha, repo):
    # Find the merge commit
    merge_commit = get_commit(deployment_sha)

    # Find the PR that created this merge
    prs = get_prs_for_commit(deployment_sha)

    # Get the first commit in the PR
    first_commit = get_first_commit_in_pr(prs[0])

    # Calculate time difference
    lead_time = deployment_time - first_commit.timestamp

    return lead_time
Simplification. If full tracing is hard, approximate. Measure from PR open time to deployment time. It’s not exact but captures most of the delay.
Exclude outliers thoughtfully. A PR that sat for three months before being deployed shouldn’t be excluded just because it’s inconvenient. That’s signal, not noise.
Measuring Change Failure Rate
Change failure rate requires defining what a failure is.
What counts as a failure?
- Rollbacks
- Hotfixes deployed within X hours
- Incidents triggered by deployments
- Feature flags immediately disabled
What doesn’t count?
- Bugs found in staging
- Bugs found days later (hard to attribute)
- Performance regressions that don’t trigger incidents
The key is consistency. Pick a definition and stick with it.
Data sources. Cross-reference deployments with:
- Rollback events
- Incident management systems (PagerDuty, Opsgenie)
- Hotfix deployments (often tagged differently)
def calculate_cfr(deployments, incidents, window_hours=24):
    failures = 0

    for deployment in deployments:
        # Check for incidents within window after deployment
        related_incidents = [i for i in incidents
                           if i.trigger_time > deployment.time
                           and i.trigger_time < deployment.time + window_hours]

        if related_incidents:
            failures += 1

    return failures / len(deployments)
Measuring Time to Restore
Time to restore measures incident recovery capability.
Definition. Time from incident start to incident resolution.
Data source. Your incident management system. PagerDuty, Opsgenie, and most tools provide API access to incident timelines.
Considerations:
- Use time to mitigate, not time to root cause
- Exclude incidents that weren’t actually service-impacting
- Track by severity - P1 recovery time matters more than P4
def calculate_mttr(incidents):
    restore_times = []

    for incident in incidents:
        if incident.severity <= 2:  # P1 and P2 only
            restore_time = incident.resolved_at - incident.triggered_at
            restore_times.append(restore_time)

    return median(restore_times)  # Median is more robust than mean
Building the Dashboard
Once you’re collecting data, visualise it usefully.
Show trends, not just current values. A 5% failure rate means nothing without context. Is it improving or degrading?
Compare to benchmarks. The DORA State of DevOps report publishes benchmarks:
- Elite: Deploy on-demand, <1 hour lead time, <15% CFR, <1 hour restore
- High: Weekly-monthly deploys, <1 week lead time, 16-30% CFR, <1 day restore
- Medium: Monthly-6 monthly, 1-6 months lead time, 31-45% CFR, <1 week restore
- Low: <6 months deploys, >6 months lead time, >45% CFR, >6 months restore
Show by team. Aggregated metrics hide team-level problems. Let teams see their own performance.
Avoid vanity displays. A giant number showing “500 deployments this month” looks impressive but doesn’t help improvement. Show metrics that prompt action.
Common Implementation Mistakes
Measuring too precisely. Don’t spend months building perfect measurement. Start with approximations and refine. Some data is better than no data.
Ignoring context. Raw numbers without context mislead. A team that deploys 10x daily but only has 2 services isn’t necessarily high-performing.
Making metrics targets. The moment you tie DORA metrics to performance reviews, people game them. Deploy empty commits to boost frequency. Classify incidents as non-failures.
Forgetting the why. DORA metrics are a means, not an end. The goal is delivering value to customers, not optimising numbers.
Not acting on insights. Dashboards are useless without action. If lead time is high, do something about it. Otherwise, don’t bother measuring.
Using Metrics to Drive Improvement
Metrics should prompt questions, not answers.
If deployment frequency is low: What’s blocking more frequent deploys? Manual testing? Change approval processes? Fear of breaking things?
If lead time is high: Where does time go? Waiting for code review? Waiting for CI? Waiting for deployment windows?
If change failure rate is high: Are we testing effectively? Are we deploying too much at once? Is production observability lacking?
If time to restore is high: Do we have runbooks? Can we roll back quickly? Do we know how to diagnose issues?
Each question leads to specific improvements. Metrics don’t tell you what to do - they tell you where to look.
Tooling Options
Several tools can help collect DORA metrics:
Sleuth - Purpose-built for DORA. Integrates with common tools, provides dashboards out of the box.
LinearB - Broader engineering metrics including DORA. Good if you want more than just deployment metrics.
Faros - Open source option. More setup required but full control.
Custom. If you have platform engineers, building custom collection isn’t hard. Prometheus + Grafana with some Python scripts can work.
My recommendation: start custom, move to tooling if you need polish. Understanding how the data flows helps you trust it.
Starting Point
If you’re starting from zero:
Week 1: Instrument deployment frequency. Just count deploys per day. Put it on a visible dashboard.
Week 2: Add lead time tracking. Start with PR-open-to-deploy time.
Week 3: Add change failure rate. Cross-reference deploys with incidents.
Week 4: Add time to restore. Pull from your incident management tool.
Ongoing: Review metrics weekly with the team. Ask what they tell you. Make one improvement based on what you learn.
DORA metrics aren’t magic. They’re a starting point for continuous improvement. Implement them, use them to ask questions, and act on what you learn.