Observability tooling has been fragmented for years. Prometheus for metrics. Jaeger for traces. ELK for logs. Different agents, different formats, different query languages.
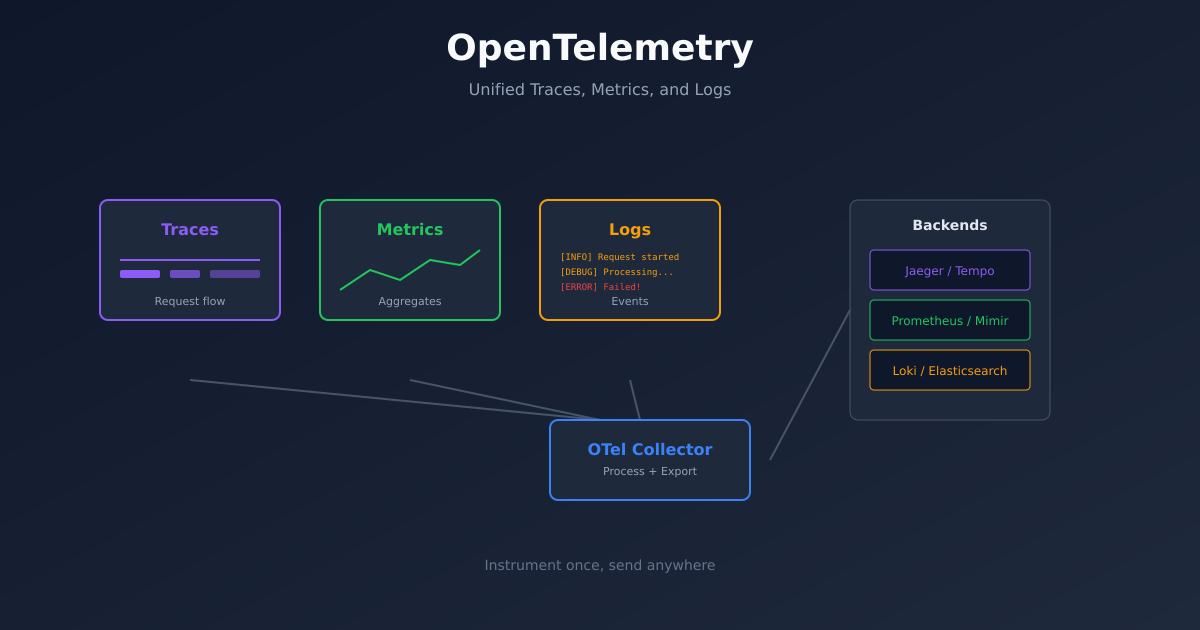
OpenTelemetry changes this. It’s a single standard for collecting telemetry data - traces, metrics, and logs - from your applications. Instrument once, send anywhere.
This guide covers how to implement OpenTelemetry from scratch, including the parts the documentation glosses over.

Why OpenTelemetry
Before OpenTelemetry, every observability vendor had their own instrumentation. If you used Datadog, you used Datadog’s SDK. Switch to New Relic? Rewrite your instrumentation.
OpenTelemetry is vendor-neutral. You instrument your code with OTel, then send data to whatever backend you want - Jaeger, Zipkin, Prometheus, Datadog, Honeycomb, or all of them simultaneously.
The other benefit is correlation. When traces, metrics, and logs share the same context (trace IDs, service names, resource attributes), debugging becomes dramatically easier. You can go from an error log to the exact trace that caused it.
The Three Signals
OpenTelemetry handles three types of telemetry:
Traces show the path of a request through your system. A single trace contains multiple spans, each representing a unit of work. When a request hits your API, calls a database, and returns a response - that’s one trace with multiple spans.
Metrics are numerical measurements over time. Request count, latency percentiles, CPU usage, queue depth. Metrics tell you what’s happening at aggregate.
Logs are discrete events. Error messages, audit records, debug output. Logs tell you what happened at a specific moment.
Each signal has its strengths. Traces for understanding request flow. Metrics for alerting and dashboards. Logs for detailed debugging. Together, they give complete observability.
Basic Architecture
A typical OpenTelemetry setup has three components:
Instrumentation in your application code generates telemetry data. This can be automatic (agent-based) or manual (SDK calls).
The Collector receives telemetry, processes it, and exports it to backends. It’s optional - you can send directly to backends - but recommended for production.
Backends store and query the data. Jaeger for traces, Prometheus for metrics, Loki for logs. Or all-in-one platforms like Grafana Cloud.
Instrumenting a Python Application
Let’s instrument a Flask application. First, install the packages:
pip install opentelemetry-api \
    opentelemetry-sdk \
    opentelemetry-instrumentation-flask \
    opentelemetry-instrumentation-requests \
    opentelemetry-exporter-otlp
Basic setup:
from opentelemetry import trace
from opentelemetry.sdk.trace import TracerProvider
from opentelemetry.sdk.trace.export import BatchSpanProcessor
from opentelemetry.exporter.otlp.proto.grpc.trace_exporter import OTLPSpanExporter
from opentelemetry.sdk.resources import Resource
from opentelemetry.instrumentation.flask import FlaskInstrumentor
from opentelemetry.instrumentation.requests import RequestsInstrumentor

# Configure the tracer
resource = Resource.create({
    "service.name": "my-api",
    "service.version": "1.0.0",
    "deployment.environment": "production"
})

provider = TracerProvider(resource=resource)
processor = BatchSpanProcessor(OTLPSpanExporter(endpoint="http://collector:4317"))
provider.add_span_processor(processor)
trace.set_tracer_provider(provider)

# Auto-instrument Flask and requests
FlaskInstrumentor().instrument()
RequestsInstrumentor().instrument()

# Your Flask app
from flask import Flask
app = Flask(__name__)

@app.route("/")
def hello():
    return "Hello, World!"
This automatically traces all Flask requests and outgoing HTTP calls. No manual span creation needed for basic visibility.
Adding Custom Spans
Auto-instrumentation covers HTTP boundaries. For visibility into your business logic, add custom spans:
from opentelemetry import trace

tracer = trace.get_tracer(__name__)

def process_order(order_id):
    with tracer.start_as_current_span("process_order") as span:
        span.set_attribute("order.id", order_id)

        # Validate order
        with tracer.start_as_current_span("validate_order"):
            validate(order_id)

        # Charge payment
        with tracer.start_as_current_span("charge_payment"):
            charge(order_id)

        # Send confirmation
        with tracer.start_as_current_span("send_confirmation"):
            notify(order_id)
Now when you view a trace, you’ll see the breakdown of time spent in each step.
Setting Up the Collector
The OpenTelemetry Collector receives, processes, and exports telemetry. Deploy it with this configuration:
receivers:
  otlp:
    protocols:
      grpc:
        endpoint: 0.0.0.0:4317
      http:
        endpoint: 0.0.0.0:4318

processors:
  batch:
    timeout: 1s
    send_batch_size: 1024

  memory_limiter:
    check_interval: 1s
    limit_mib: 1000
    spike_limit_mib: 200

exporters:
  jaeger:
    endpoint: jaeger:14250
    tls:
      insecure: true

  prometheus:
    endpoint: 0.0.0.0:8889

  loki:
    endpoint: http://loki:3100/loki/api/v1/push

service:
  pipelines:
    traces:
      receivers: [otlp]
      processors: [memory_limiter, batch]
      exporters: [jaeger]

    metrics:
      receivers: [otlp]
      processors: [memory_limiter, batch]
      exporters: [prometheus]

    logs:
      receivers: [otlp]
      processors: [memory_limiter, batch]
      exporters: [loki]
This collector receives OTLP data and fans it out to Jaeger (traces), Prometheus (metrics), and Loki (logs).
For Kubernetes, deploy as a DaemonSet or Deployment:
apiVersion: apps/v1
kind: Deployment
metadata:
  name: otel-collector
spec:
  replicas: 2
  selector:
    matchLabels:
      app: otel-collector
  template:
    spec:
      containers:
        - name: collector
          image: otel/opentelemetry-collector-contrib:latest
          args: ["--config=/etc/otel/config.yaml"]
          ports:
            - containerPort: 4317
            - containerPort: 4318
          volumeMounts:
            - name: config
              mountPath: /etc/otel
      volumes:
        - name: config
          configMap:
            name: otel-collector-config
Metrics with OpenTelemetry
Metrics work similarly to traces. Create a meter and record measurements:
from opentelemetry import metrics
from opentelemetry.sdk.metrics import MeterProvider
from opentelemetry.sdk.metrics.export import PeriodicExportingMetricReader
from opentelemetry.exporter.otlp.proto.grpc.metric_exporter import OTLPMetricExporter

# Configure metrics
reader = PeriodicExportingMetricReader(
    OTLPMetricExporter(endpoint="http://collector:4317"),
    export_interval_millis=60000
)
provider = MeterProvider(metric_readers=[reader], resource=resource)
metrics.set_meter_provider(provider)

# Create instruments
meter = metrics.get_meter(__name__)

request_counter = meter.create_counter(
    "http_requests_total",
    description="Total HTTP requests"
)

latency_histogram = meter.create_histogram(
    "http_request_duration_seconds",
    description="HTTP request latency"
)

# Use them
def handle_request():
    start = time.time()

    # ... handle request ...

    duration = time.time() - start
    request_counter.add(1, {"method": "GET", "status": "200"})
    latency_histogram.record(duration, {"method": "GET", "endpoint": "/api"})
Logs with Context
The newest addition to OpenTelemetry is logs. The key feature is correlation - logs include trace and span IDs automatically.
import logging
from opentelemetry._logs import set_logger_provider
from opentelemetry.sdk._logs import LoggerProvider, LoggingHandler
from opentelemetry.sdk._logs.export import BatchLogRecordProcessor
from opentelemetry.exporter.otlp.proto.grpc._log_exporter import OTLPLogExporter

# Configure logging
logger_provider = LoggerProvider(resource=resource)
logger_provider.add_log_record_processor(
    BatchLogRecordProcessor(OTLPLogExporter(endpoint="http://collector:4317"))
)
set_logger_provider(logger_provider)

# Add OTel handler to Python logging
handler = LoggingHandler(level=logging.INFO, logger_provider=logger_provider)
logging.getLogger().addHandler(handler)

# Now regular logging includes trace context
logger = logging.getLogger(__name__)
logger.info("Processing order", extra={"order_id": "12345"})
When you view this log in Loki or Grafana, it includes the trace ID. Click through to see the full trace.
Common Patterns
Service mesh integration. If you’re using Istio or Linkerd, they generate traces at the network level. Configure them to use the same trace headers (W3C Trace Context), and OTel traces will connect to service mesh traces.
Sampling. Not every request needs to be traced. Configure sampling to reduce volume:
from opentelemetry.sdk.trace.sampling import TraceIdRatioBased

provider = TracerProvider(
    resource=resource,
    sampler=TraceIdRatioBased(0.1)  # Sample 10% of traces
)
Baggage. Pass context across services without it appearing in spans:
from opentelemetry import baggage

baggage.set_baggage("user.id", "12345")
# This value propagates to downstream services
Kubernetes Auto-instrumentation
For Kubernetes, the OTel Operator can auto-instrument pods without code changes:
apiVersion: opentelemetry.io/v1alpha1
kind: Instrumentation
metadata:
  name: my-instrumentation
spec:
  exporter:
    endpoint: http://otel-collector:4317
  propagators:
    - tracecontext
    - baggage
  python:
    image: ghcr.io/open-telemetry/opentelemetry-operator/autoinstrumentation-python:latest
Then annotate your deployments:
apiVersion: apps/v1
kind: Deployment
metadata:
  name: my-app
spec:
  template:
    metadata:
      annotations:
        instrumentation.opentelemetry.io/inject-python: "true"
The operator injects the instrumentation automatically. No code changes required.
Making Sense of the Data
Collecting telemetry is pointless without using it effectively.
Start with traces for debugging. When something breaks, find the trace. The spans show exactly where time was spent and where errors occurred.
Use metrics for alerting. Don’t alert on traces. Traces are samples. Metrics are aggregates. Alert when error_rate exceeds your SLO.
Correlate through trace IDs. Error log → find trace ID → view trace → understand context. This workflow should take seconds.
Build service maps. Most tracing backends can generate service dependency maps from trace data. Use these to understand your architecture.
Getting Started
Week 1: Instrument one service with traces. Send to Jaeger. Get comfortable with the trace view.
Week 2: Add the collector. Configure sampling. Add a second service.
Week 3: Add metrics. Create a basic Grafana dashboard.
Week 4: Add logs with trace correlation. Practice the debug workflow.
OpenTelemetry has a learning curve, but the payoff is significant. Unified observability beats cobbled-together tools every time.